PED quickstart#
Configuration#
We start by (optionally) setting our configuration. See documentation for details.
abtem.config.set(
    {
        "device": "cpu",
        "fft": "fftw",
        "diagnostics.task_progress": False,
        "diagnostics.progress_bar": False,
    }
);
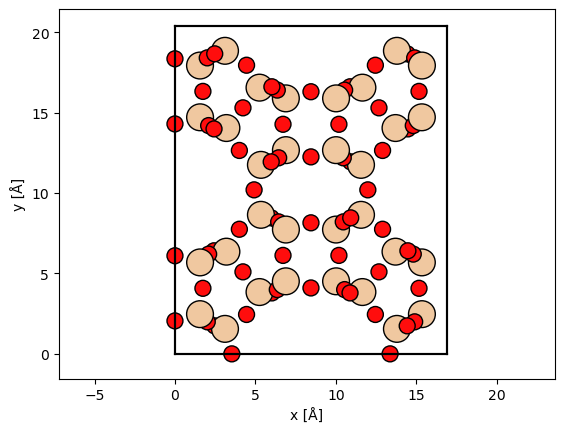
Atomic model#
atoms = read("data/SiO2_zeolite.cif")

cell = atoms.cell.copy()

atoms = atoms * (1, 1, 20)

abtem.show_atoms(atoms, plane="xy");
frozen_phonons = abtem.FrozenPhonons(atoms, 8, sigmas=0.078)
potential = abtem.Potential(
    frozen_phonons,
    sampling=0.05,
    projection="infinite",
    slice_thickness=1,
)
wave = abtem.PlaneWave(energy=100e3)
wave.grid.match(potential)
wave.tilt = precession_tilts(50, 5)
measurement = wave.multislice(potential).diffraction_patterns().mean(0).compute()
spots = (
    measurement.crop(25)
    .block_direct()
    .index_diffraction_spots(cell=atoms)
    .remove_low_intensity(1e-3)
)
visualization = spots.show(
    explode=True,
    scale=.05,
    figsize=(14, 5),
    annotations=False,
    annotation_kwargs={"threshold": 1e-2},
)
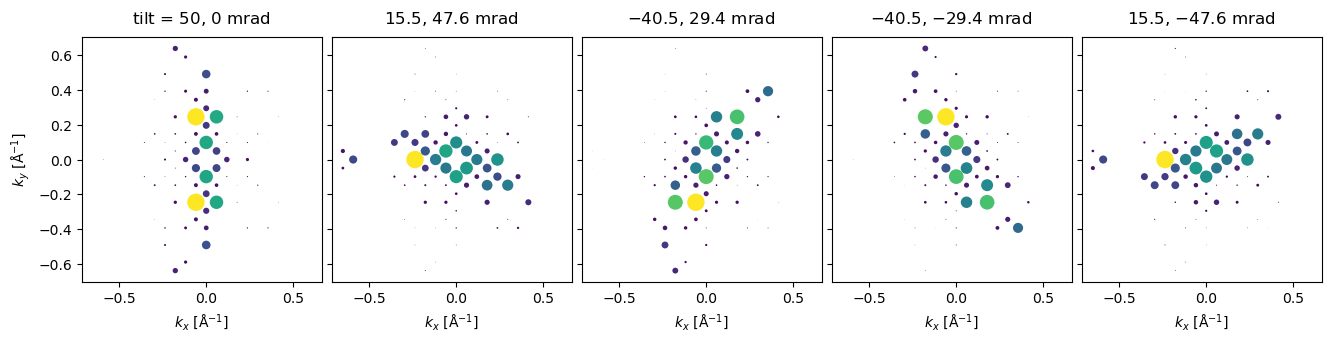
Note that PED can also be calculate using the Blochwave method, see example.